
As part of our work for the John Templeton Grant #57657 “A New Biology of Spiritual Information” awarded to the Natural Philosophy Institute for the period from Sept 2015 through August 2017, my wife Aniko Albert and I published a paper in the Journal of Theoretical and Computational Science on the theory of gene regulatory networks. This is a peer reviewed, technical paper, and it describes most of the work we did to understand how the complexity of these networks could be understood.
We plan to put the scientific work described in this paper into a more theological or spiritual context in future publications, online posts, or other methods of public dissemination. While the official period of the grant is almost over, we intend to continue to work on several other aspects of the project (including this blog) for some time to come.
The paper is freely available online at this link
The complete citation for the paper is:
Garte S, Albert A (2017) The Role of Genotype in the Predictability of Dynamical Behavior in Complex Model Gene Regulatory Networks. J Theor Comput Sci 4: 155. doi:10.4172/2376-130X.1000155
I have posted below 1) the abstract from the paper, and 2) a description of the what the paper says in less technical language, including a summary of what we found. This also includes two figures from the paper. I will be happy to answer any questions about this research in the comments section of this post.
Abstract
Models of gene regulatory networks (GRN) have proven useful for understanding many aspects of the highly complex behavior of biological control networks. Randomly generated non-Boolean networks were used in experimental simulations to generate data on dynamic phenotypes as a function of several genotypic parameters. We hypothesized that the topological component of network genotype could be an obstacle to the discovery of mathematical formulas that can predict certain phenotypic parameters. Our data support that hypothesis. We quantitated the effect of topological genotype (TGE) and determined its influence on a number of dynamical phenotypes in simple and complex multi-gene networks. For situations where the TGE was low, it was possible to infer formulas to predict some phenotypes with good accuracy based on number of network genes, interaction density, and initial conditions. In addition to formulation of these mathematical relationships, we found a number of dynamic properties, including complex oscillation behaviors, that were largely dependent on genotype topology, and for which no such formulas were determinable. For integrated measures of gene expression state, we observed a variety of oscillation patterns, including stable, periodic cycling with a wide variety of period length, aperiodic cycling, and apparent chaotic dynamics. It remains to be determined if these results are applicable to biological gene regulatory networks.
Summary
Gene regulatory networks are some of the most important and most complex functional structures in biology. Such networks or circuits control which genes are active (actually being translated into proteins), and which are silent at different times, and in different cells. We have recently learned that the systems for control of gene expression are far more elaborate and convoluted than anyone could have imagined.
For a typical network, some genes become active (turned on) because they are the target of molecular switches made by other genes. At the same time, genes can also be silenced (turned off) by the action of other genes in the network.
The result of all of these interactions between genes is an incredibly complex web of control that is challenging to analyze in any detail.
A number of researchers have tackled the complexity of GRNs by using model networks and then analyzing their behavior by mathematical and algorhythmic methods. The idea is to try to come up with some general principles that might be applicable to actual real-world biological gene networks.
That is exactly the approach we took in our research. First we designed a system of gene regulatory networks, where (for example) there are 5 genes, each of which can have many different patterns of interactions with the other genes in the network. An example is shown in Figure 1.
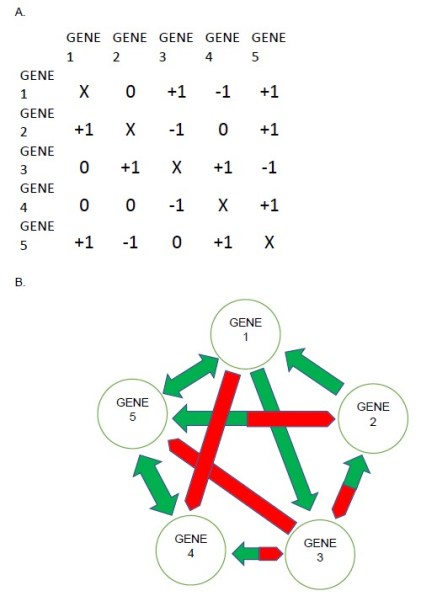
FIGURE 1. Five-gene model regulatory network. A) Matrix array showing numerical values for each interaction between all genes. The effect of genes in the rows on genes in the columns is given by 0 (no interaction), +1, or -1. Self-regulation is not included. B) A diagram of the interactive network shown in A, with green arrows showing activating interactions, and red blunted arrows showing suppressive interactions. Green double arrows (between Genes 1 and 5 and between Genes 4 and 5) indicate reciprocal activation, and bicolor arrows (between genes 3 and 4, Genes 2 and 3, and Genes 2 and 5) indicate inverse reciprocal interaction, where one gene activates another gene that suppresses it. For example, Gene 2 suppresses Gene 3, activates Genes 1 and 5, is activated by Gene 3, and suppressed by Gene 5.
To construct these networks using a random number generator. Each network we made can be described by several characteristics. These include the number of genes that activate other genes, the number of genes that suppress other genes, and the exact pattern of how all the genes interact with each other, which can be described as the “topology” of the network. All these parameters together are called the genotype of the particular network. For 5 genes, there are more than 3 billion possible genotypes.
In some kinds of networks, the effect of the topological component of the genotype is very strong, while for others, it’s weaker. We found that when the topological component (the map of the network) was not as important as the quantitative parameters of the genotype (the number of activating and suppressing genes and the total density of gene interactions), it was possible to derive very accurate formulas that could predict the behavior of the networks as a function of time and other variables. But when the topological component was dominant, such equations only gave very approximate results.
An additional finding of our experiments using these models was that the time-related behavior of some very dense networks was extremely complex. We found that many of these networks showed an oscillatory pattern, as had been seen previously. But we also found that the details of the cycling oscillations were not very predictable, and at times became so complex as to resemble chaotic dynamic behavior. Figure 2 shows examples of oscillating patterns of gene expression with time produced in some of these networks.
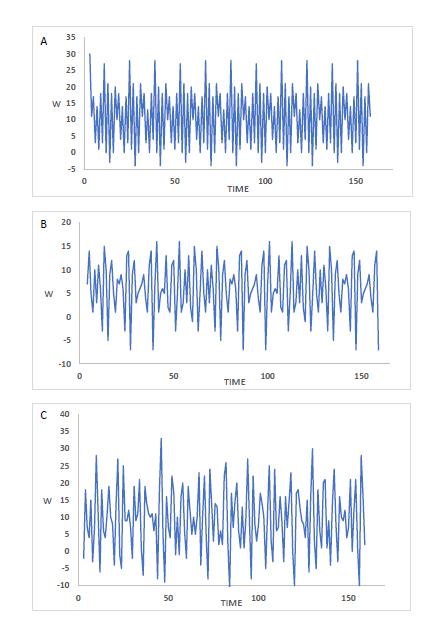
FIGURE 2. The complex oscillatory patterns of three Compound networks. A) Oscillatory period = 42 iterations. B) An example of a commonly seen period of 60 iterations (present in about 13% of Compound networks). C) An aperiodic network, with an appearance of chaotic dynamics.
We don’t know yet if any of these results will be applicable to actual biological gene regulatory networks. But we do believe that the discovery of quantitative laws that govern the dynamic behavior of certain networks and the finding of the importance of network topology in determining how accurately these laws can predict the detailed behavior will have important implications for understanding how gene regulatory networks function to allow for some of the complexity that we know is everywhere in living creatures.


 Eq 2
Eq 2
 Eq 4
Eq 4 where S is the selection coefficient related to fitness. Therefore, strong selection pressure for alleles (or new genes) that increase the ability of organisms to engage in the activities (such as reproduction or translation) that will maintain their existence results in an ever increasing dY/dT (meaning that the second derivative is positive).

